Scenario intelligence
Compare operating choices before downstream effects appear.
OreNeda connects geology, operations, processing, cost, energy, emissions, and product quality into one decision layer so teams can compare choices before they become production consequences.
Built for focused pilot conversations around site workflows, connected systems, and measurable decision outcomes. View pilot pathway
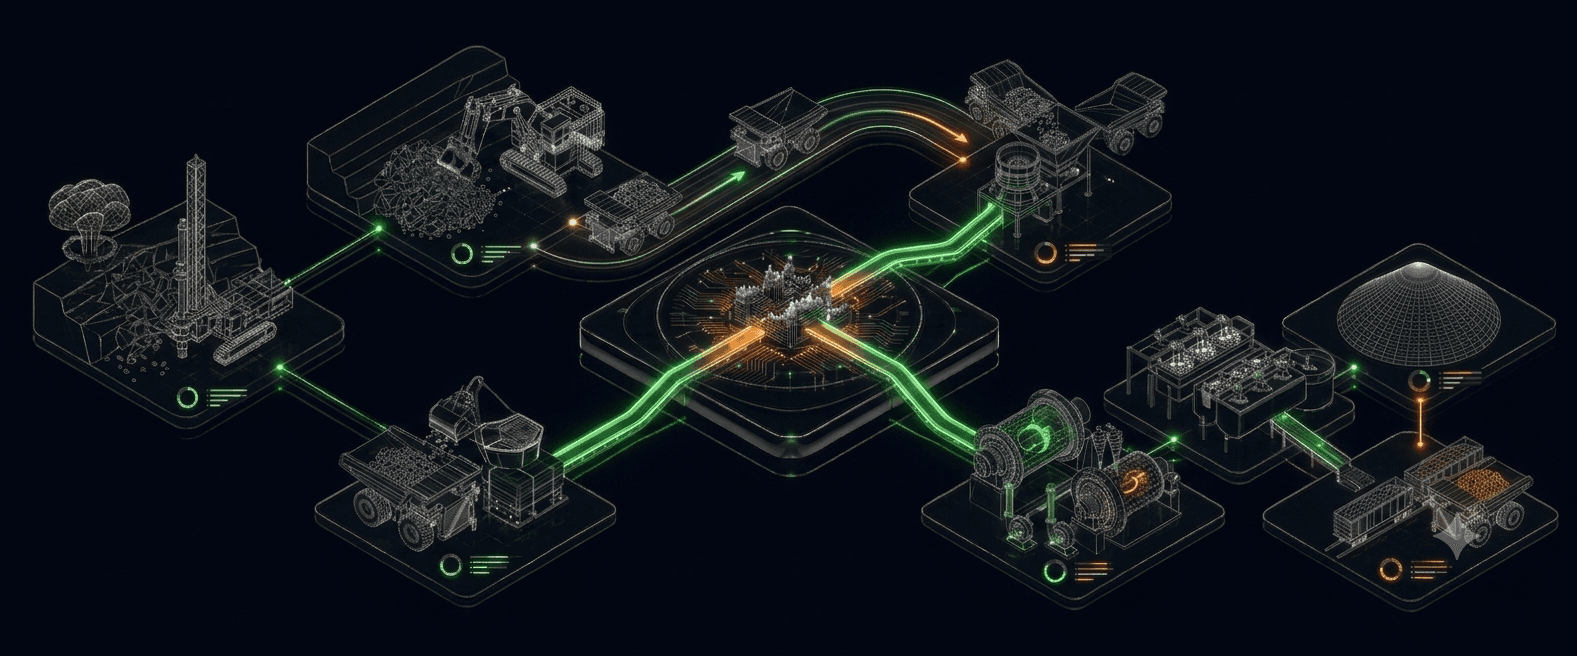
Variables analysed
Operating variables across the mine-to-product chain
Models
Unit models from resource and blast to comminution and recovery
Connected data domains
Geology, fleet, plant, lab, energy, maintenance, cost, emissions
Value-chain stages
Traced from resource block model through to product
Decision workflow steps
Sense · Model · Compare · Optimise · Decide
OreNeda connects the operating signals that normally sit in separate tools, time windows, and definitions.
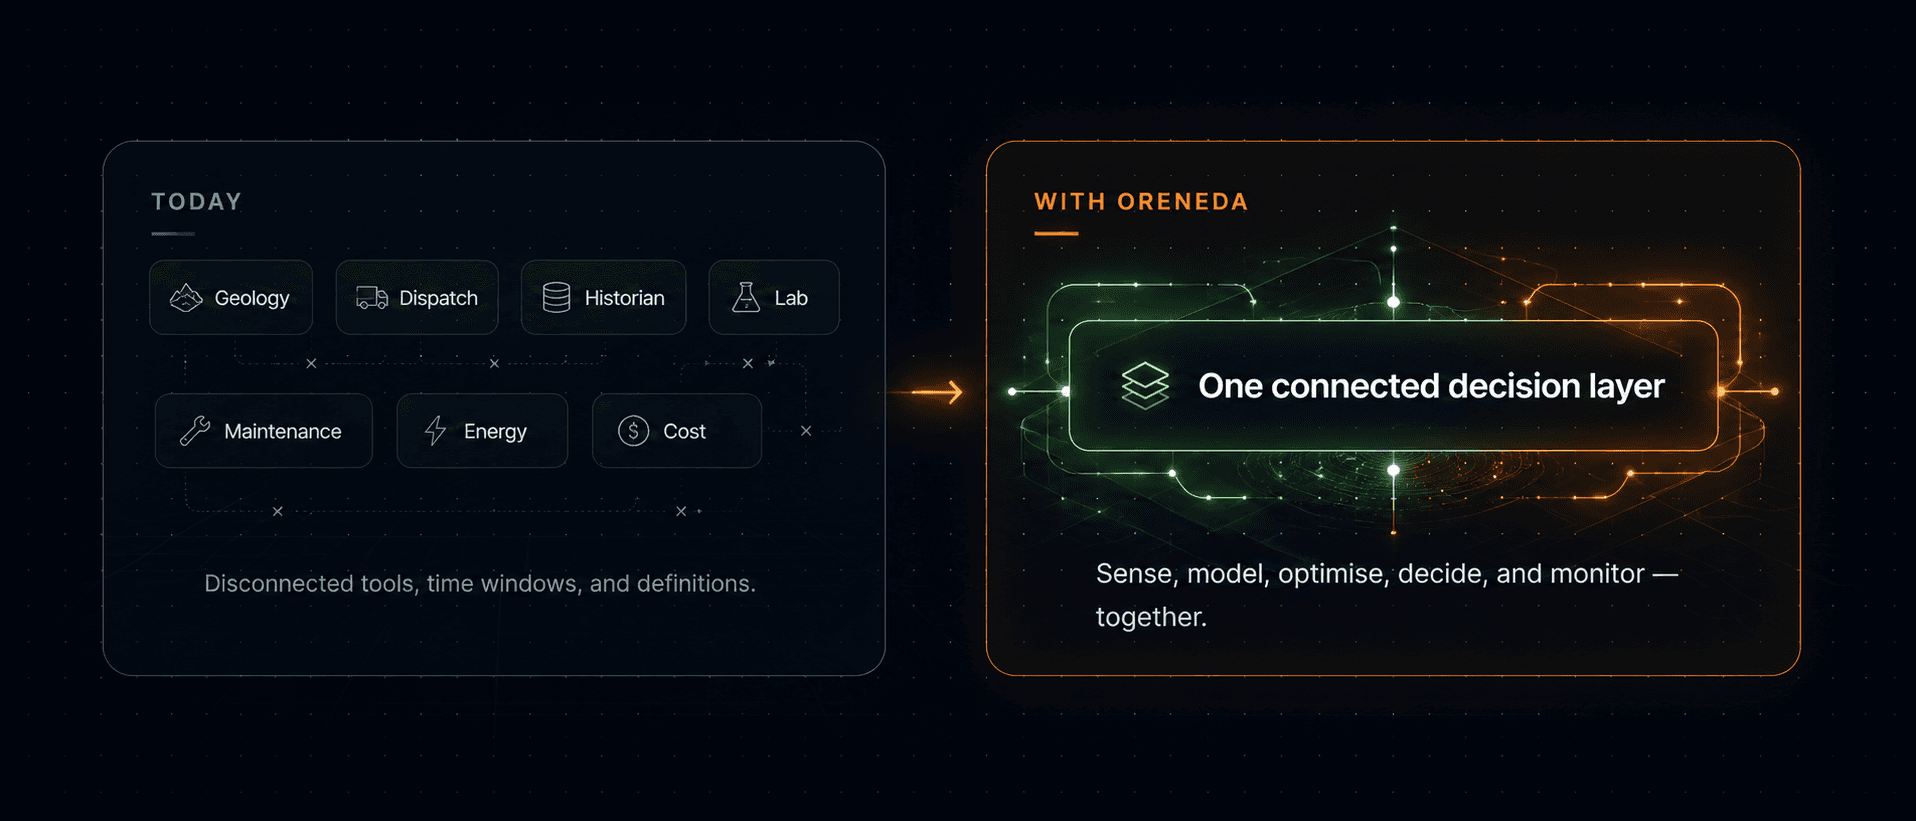
OreNeda does not just visualise data. It carries each signal through source mapping, model context, scenario comparison, and governance so a recommendation can be reviewed before use.
Decision evidence pack
Ranked pathway with constraints, confidence, model limits, expected movement, and review trail.
See the operating surfaces behind OreNeda: integrated operations, value-chain exposure, grinding control, haulage productivity, and asset health.
Control centre
Integrated operating view for shift, KPI, constraint, and value-chain review.
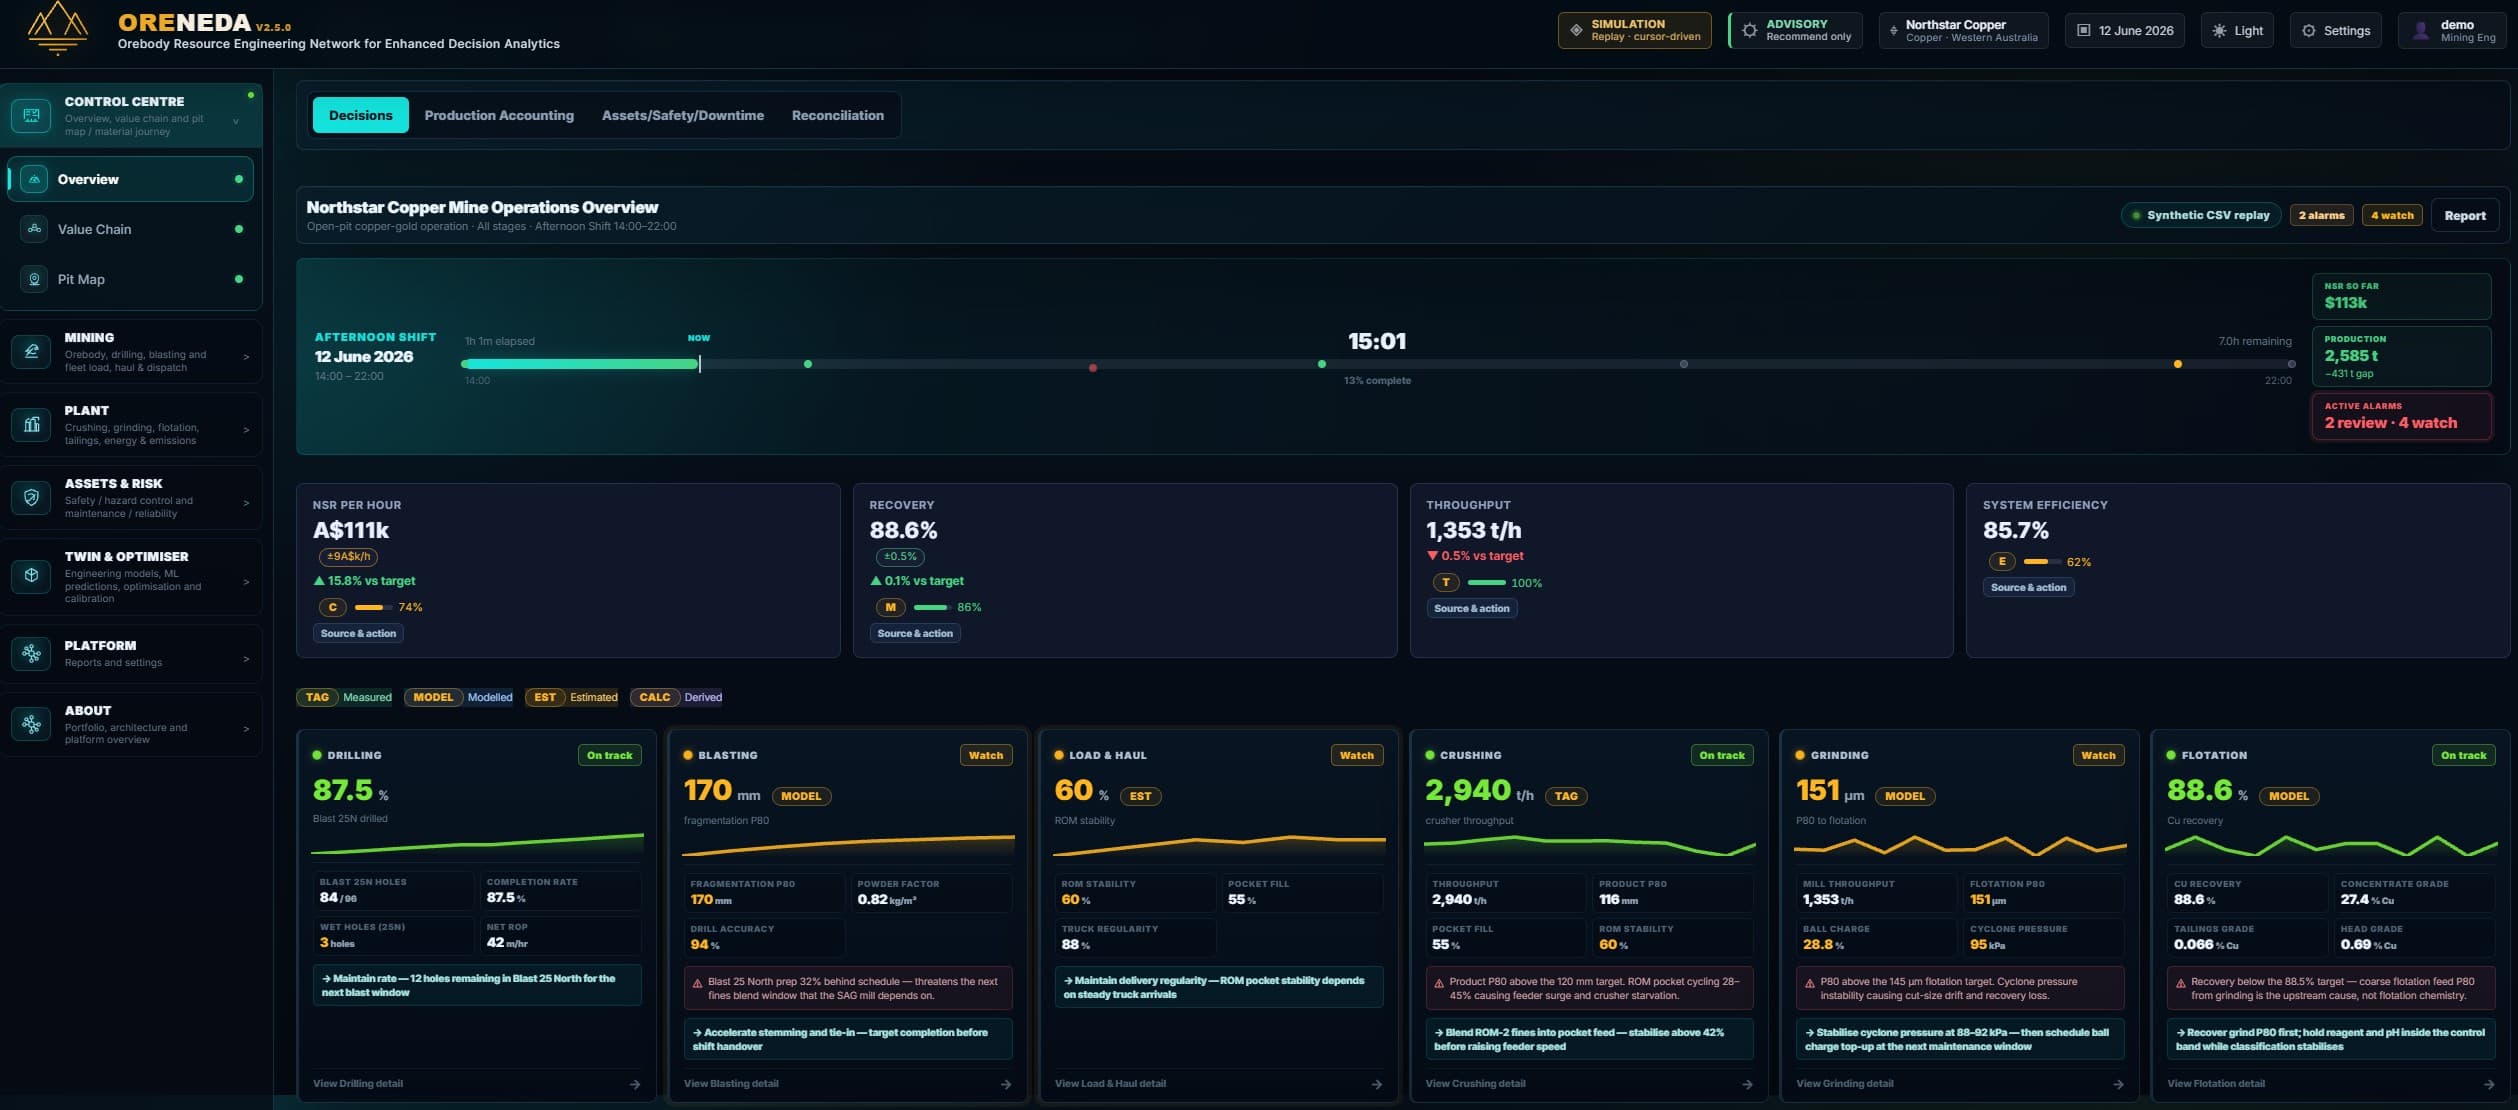
Geology, fleet, dispatch, plant historian, lab, maintenance, energy, and cost — mapped to material, asset, and time into one live picture of operating state.
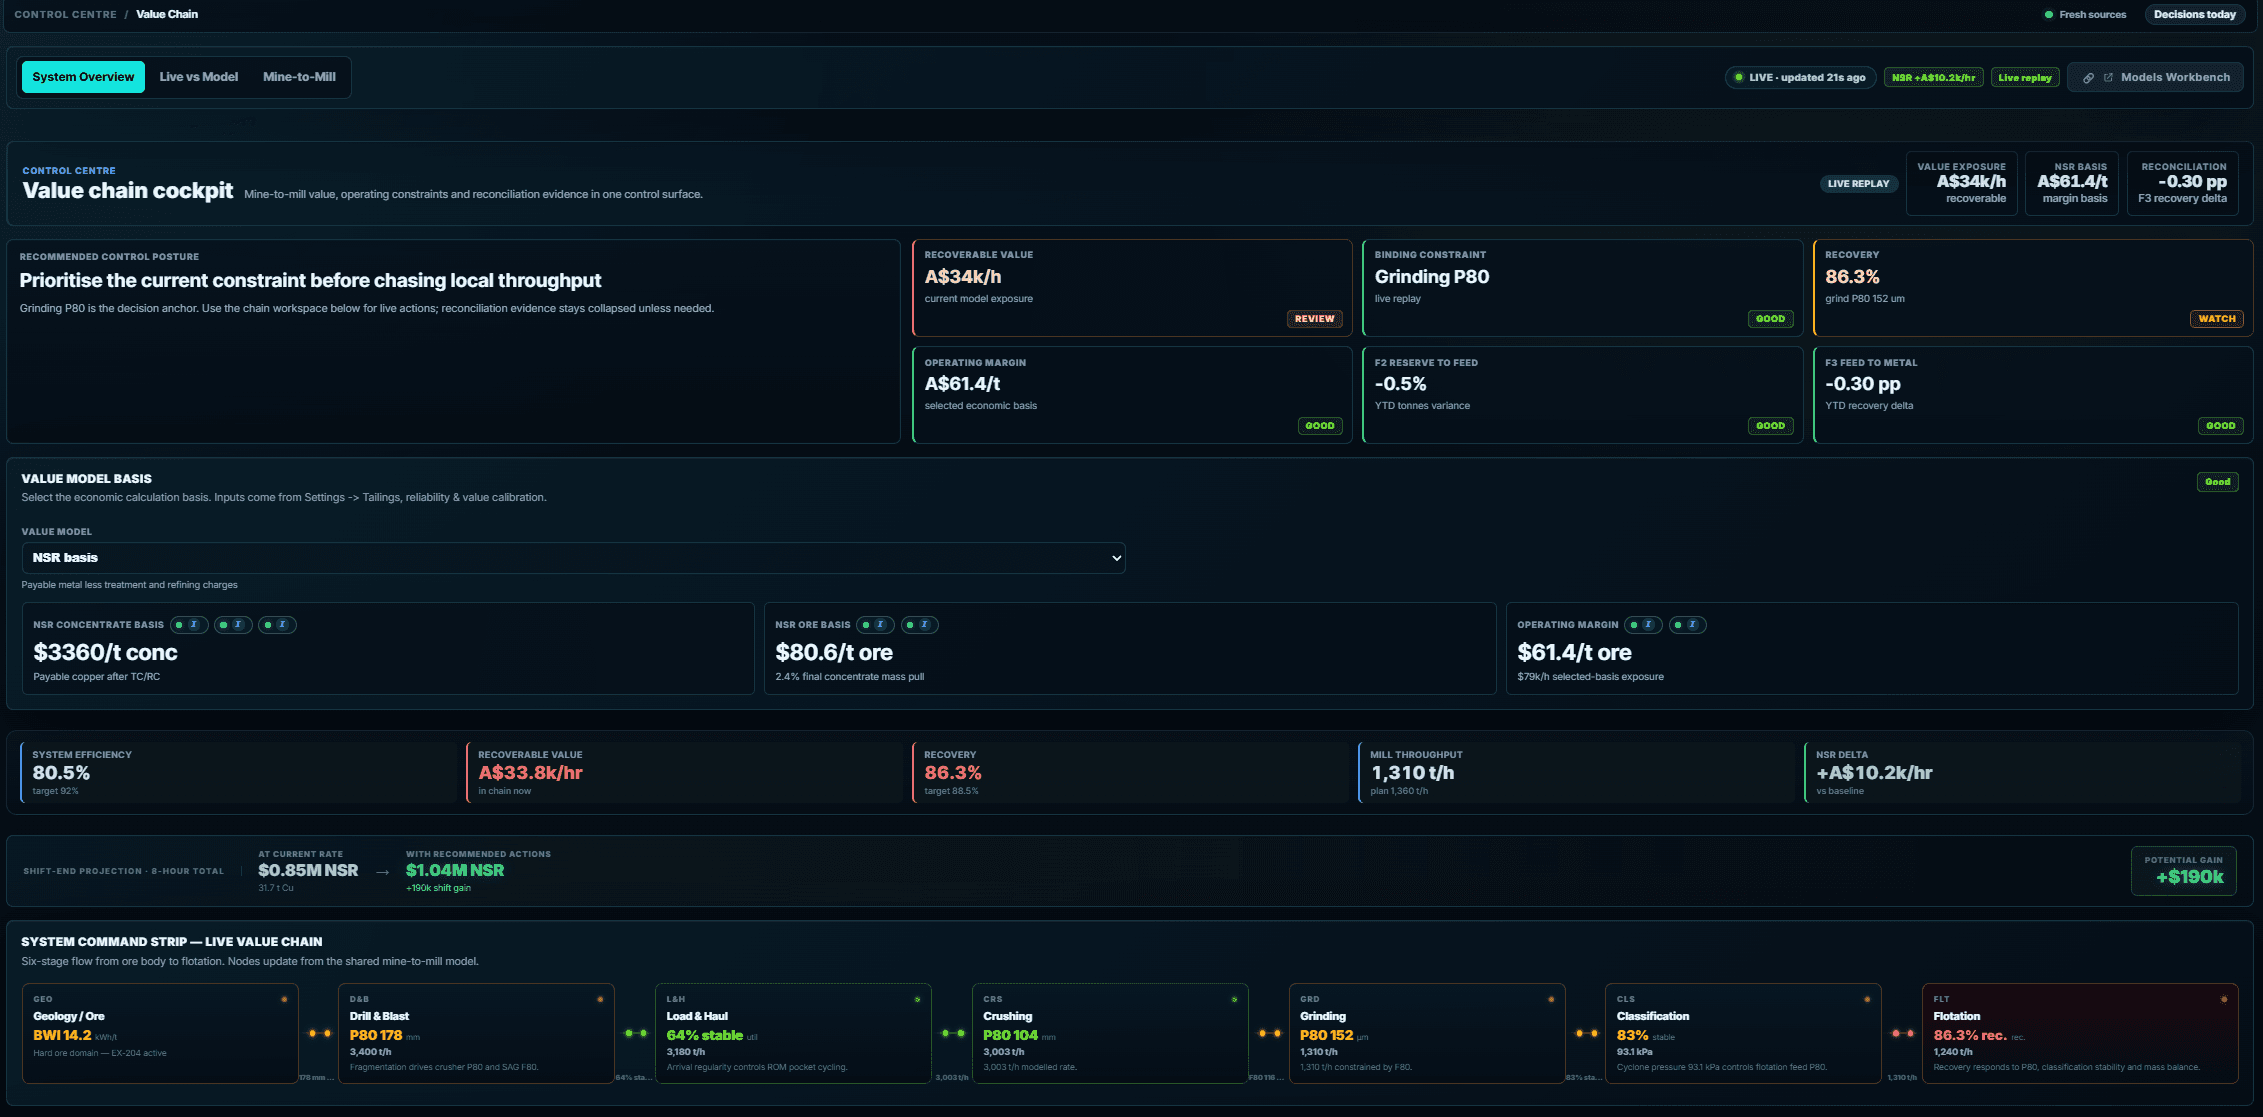
Value chain cockpit
Live value exposure, binding constraint, recovery, and command-strip state
Resource, material, equipment, and process-response models run together — fragmentation, throughput, recovery, energy, reliability — each with confidence and known limits.
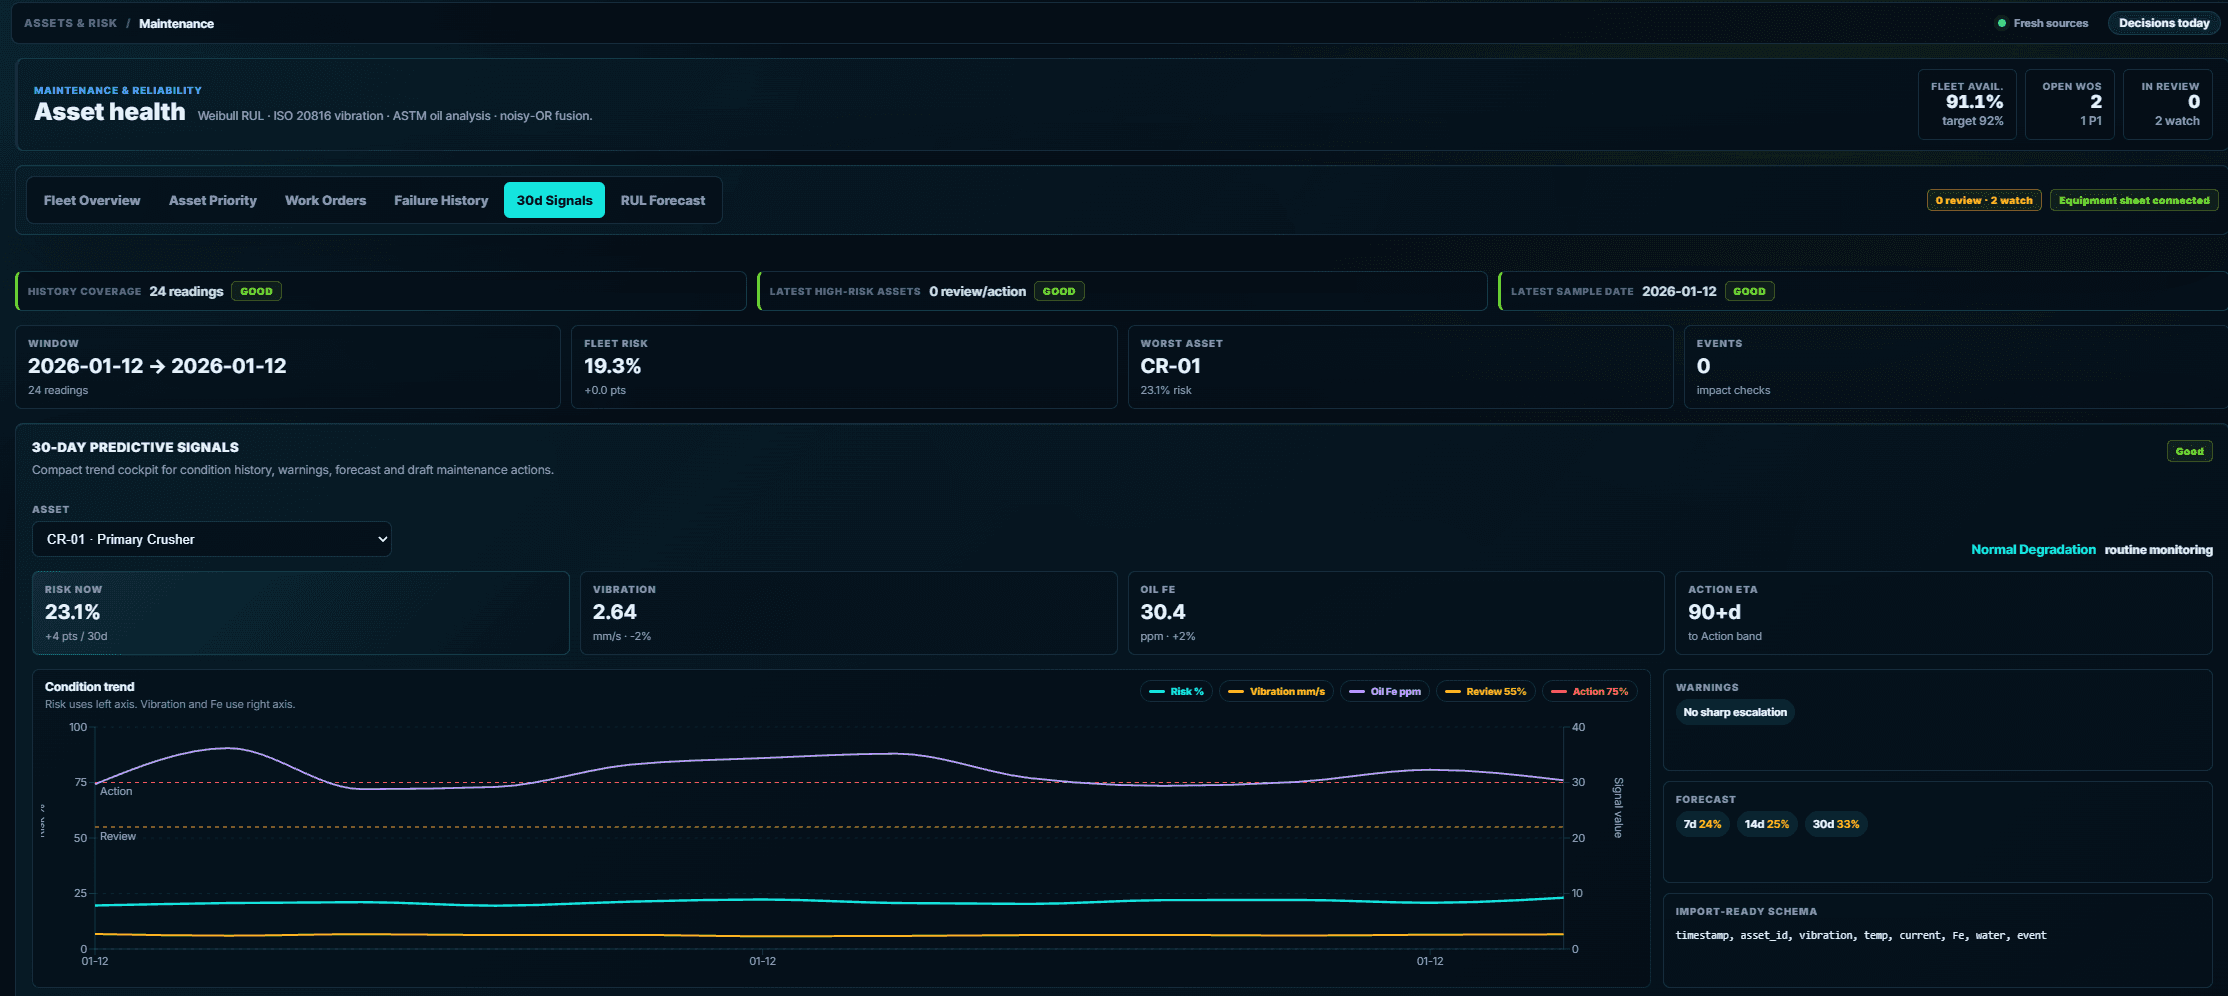
Asset health signals
Reliability risk, condition history, forecast, and warning bands
Weigh throughput, recovery, energy, cost, and emissions together, and see the trade-offs of each operating pathway side by side.
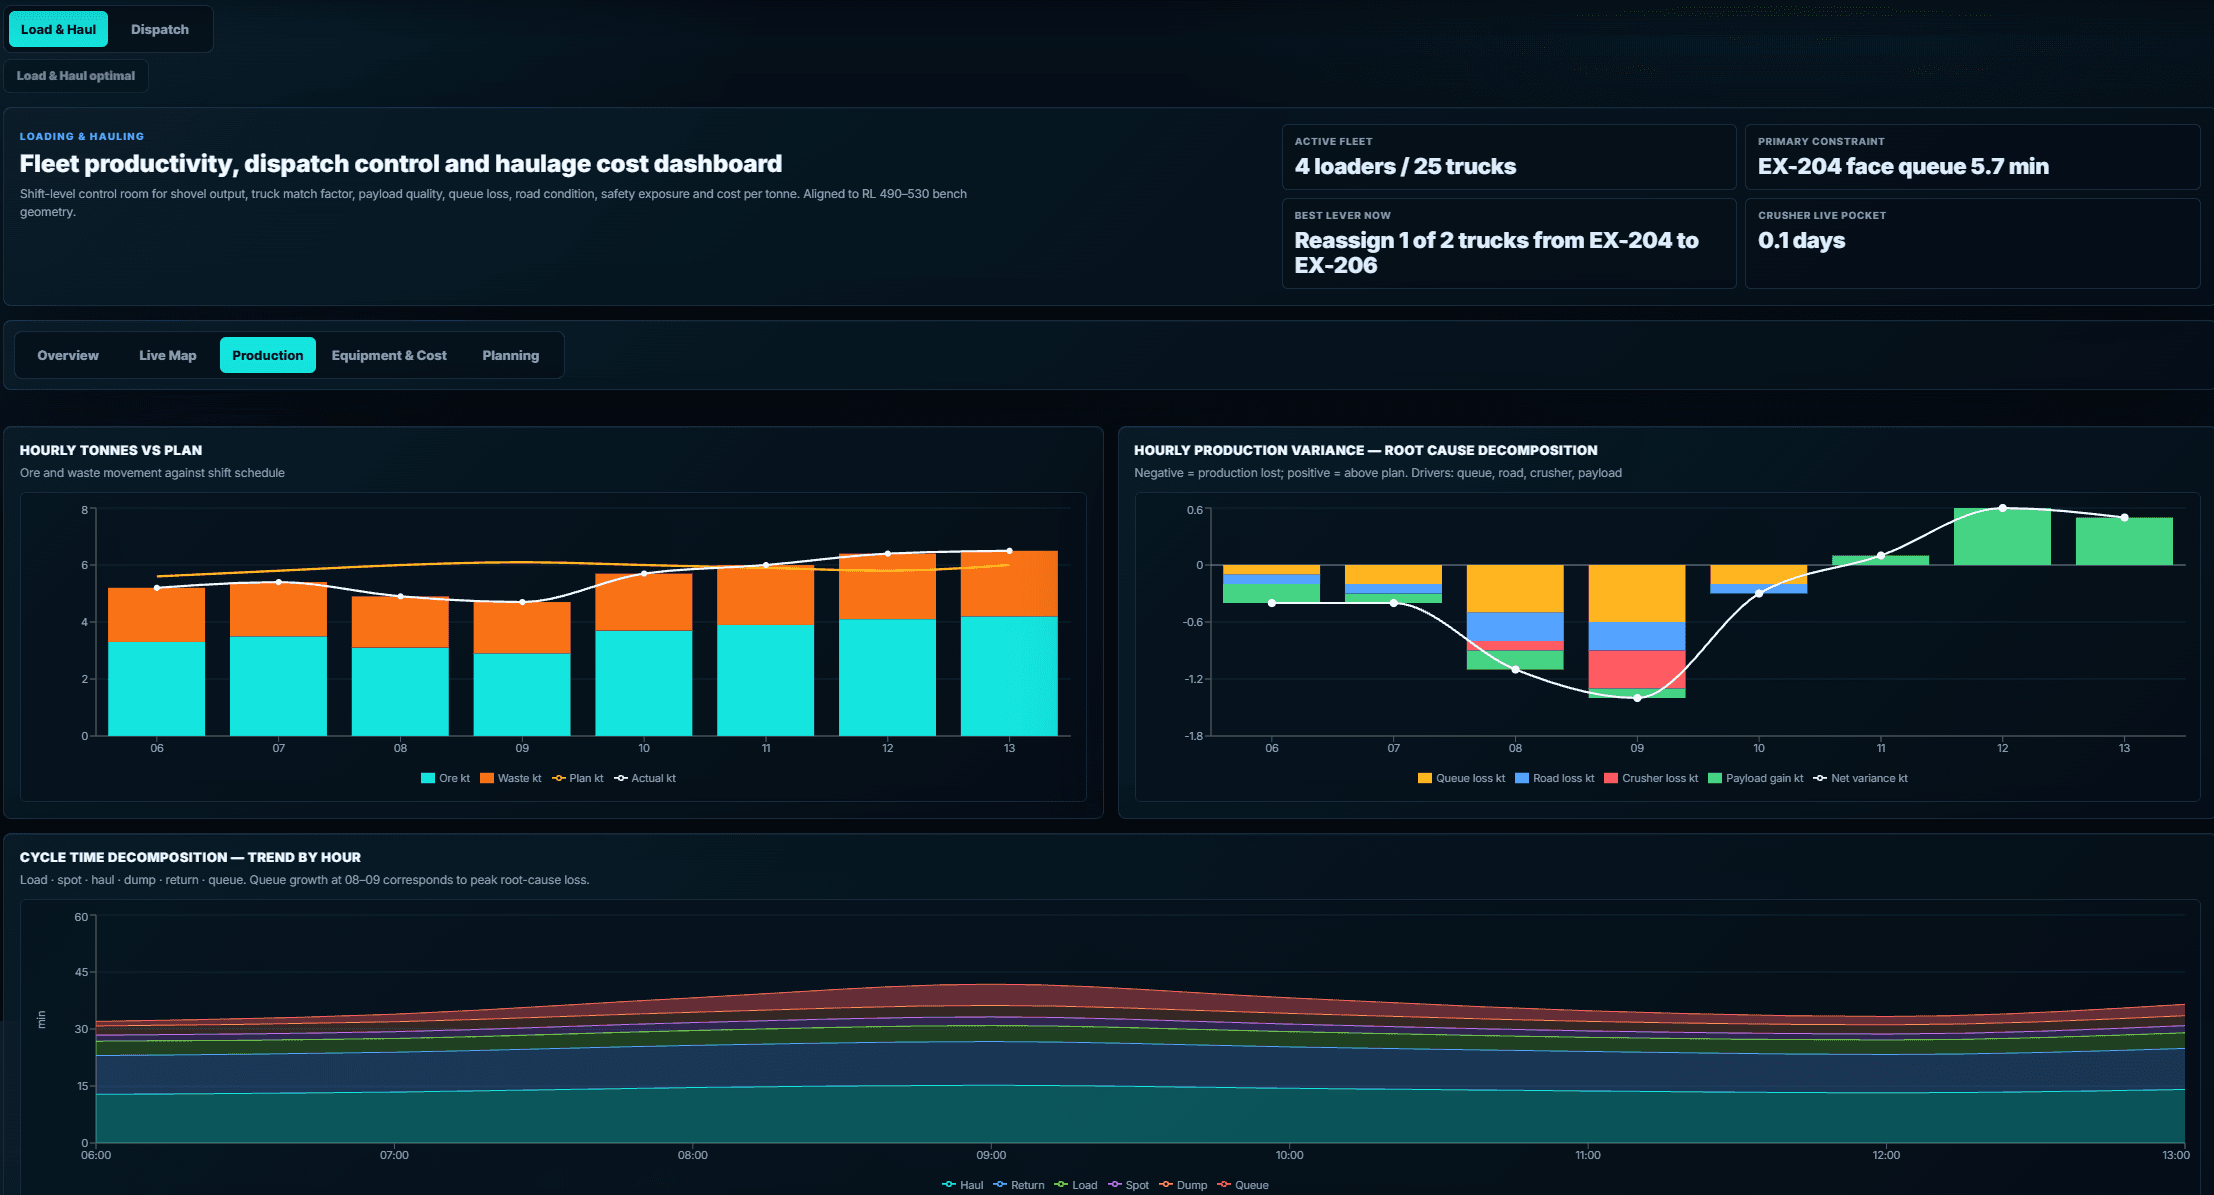
Load and haul production
Hourly tonnes, production variance, root-cause drivers, and cycle-time trend
Every recommendation carries expected movement, respected constraints, confidence, and an owner — ready for technical and management review.
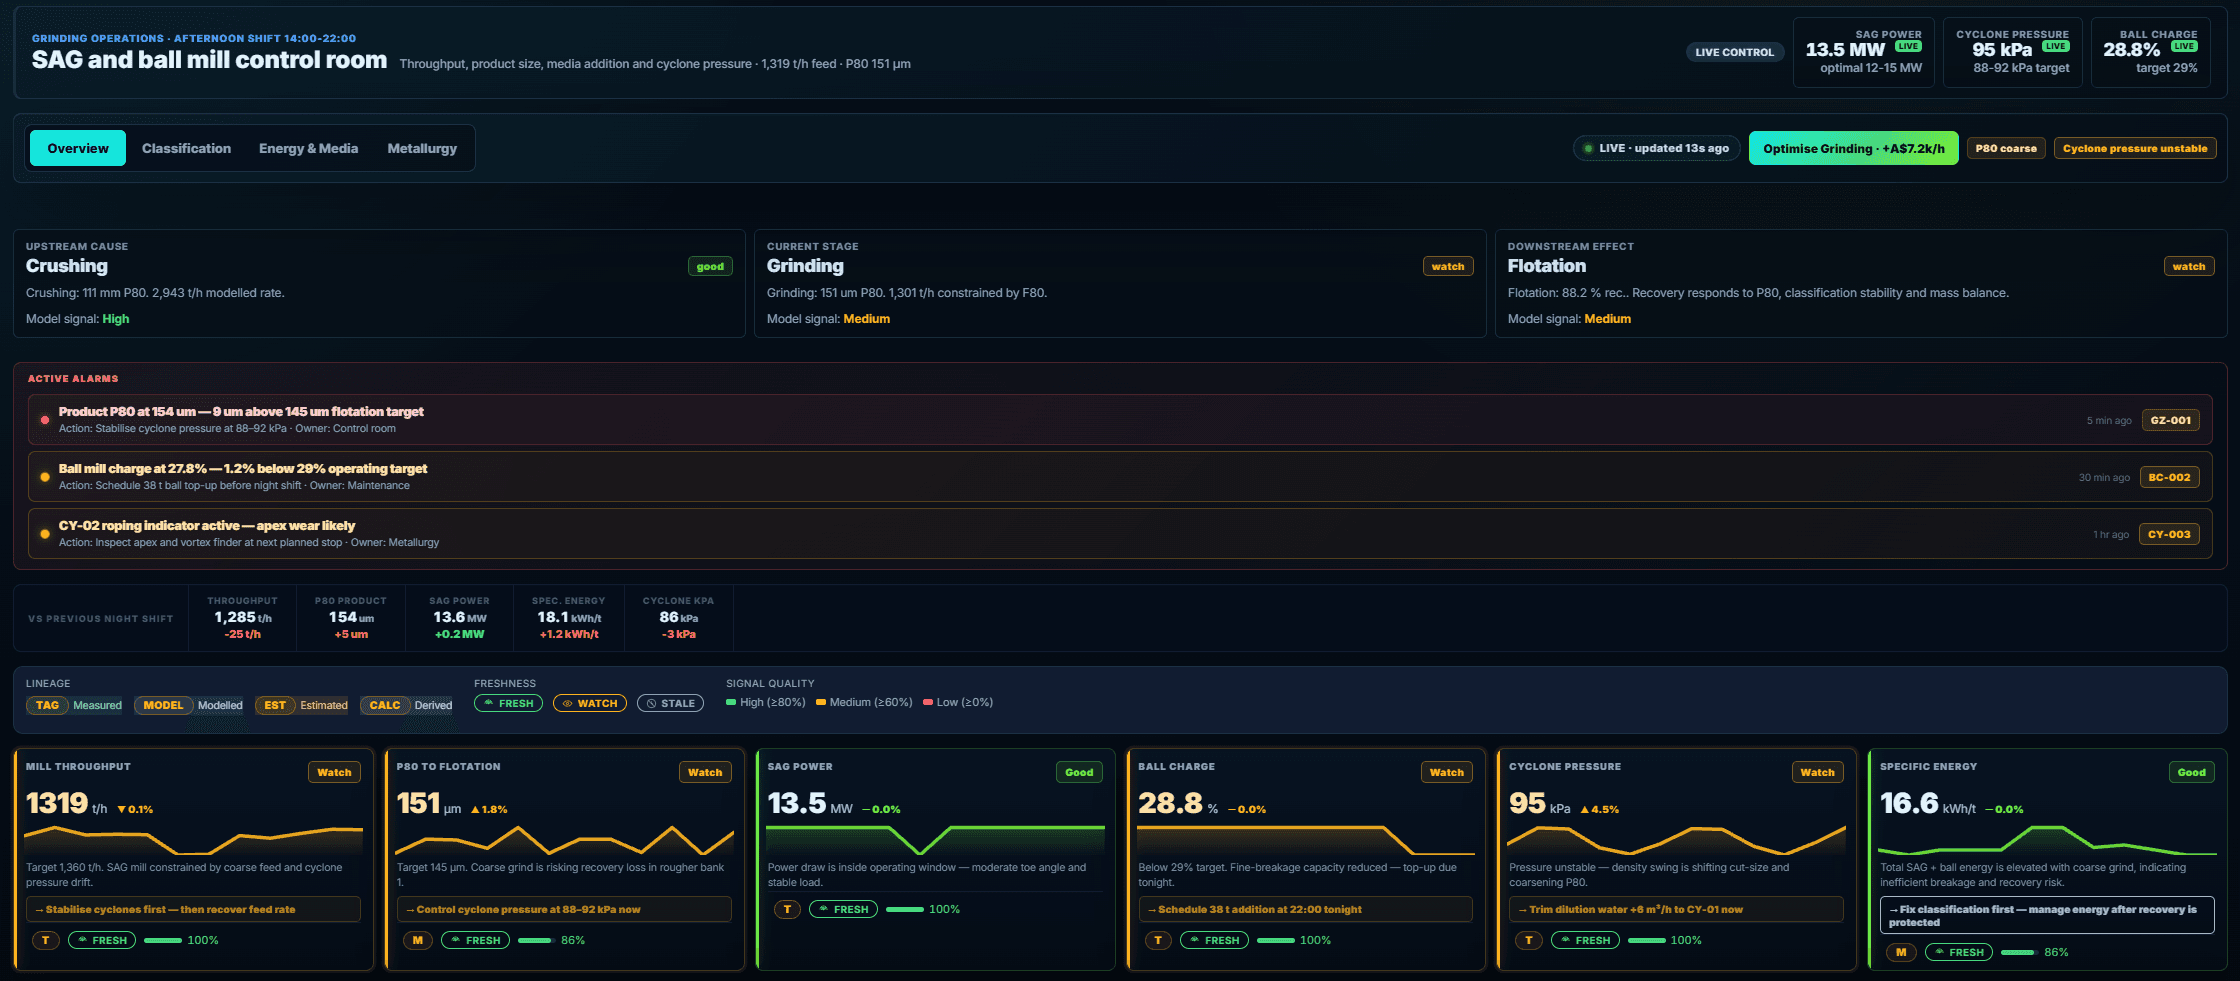
Grinding control room
Live alarms, control action, lineage, signal quality, and operating cards
Track KPIs, constraints, deviations, and whether decisions delivered — closing the loop from action to operating result.
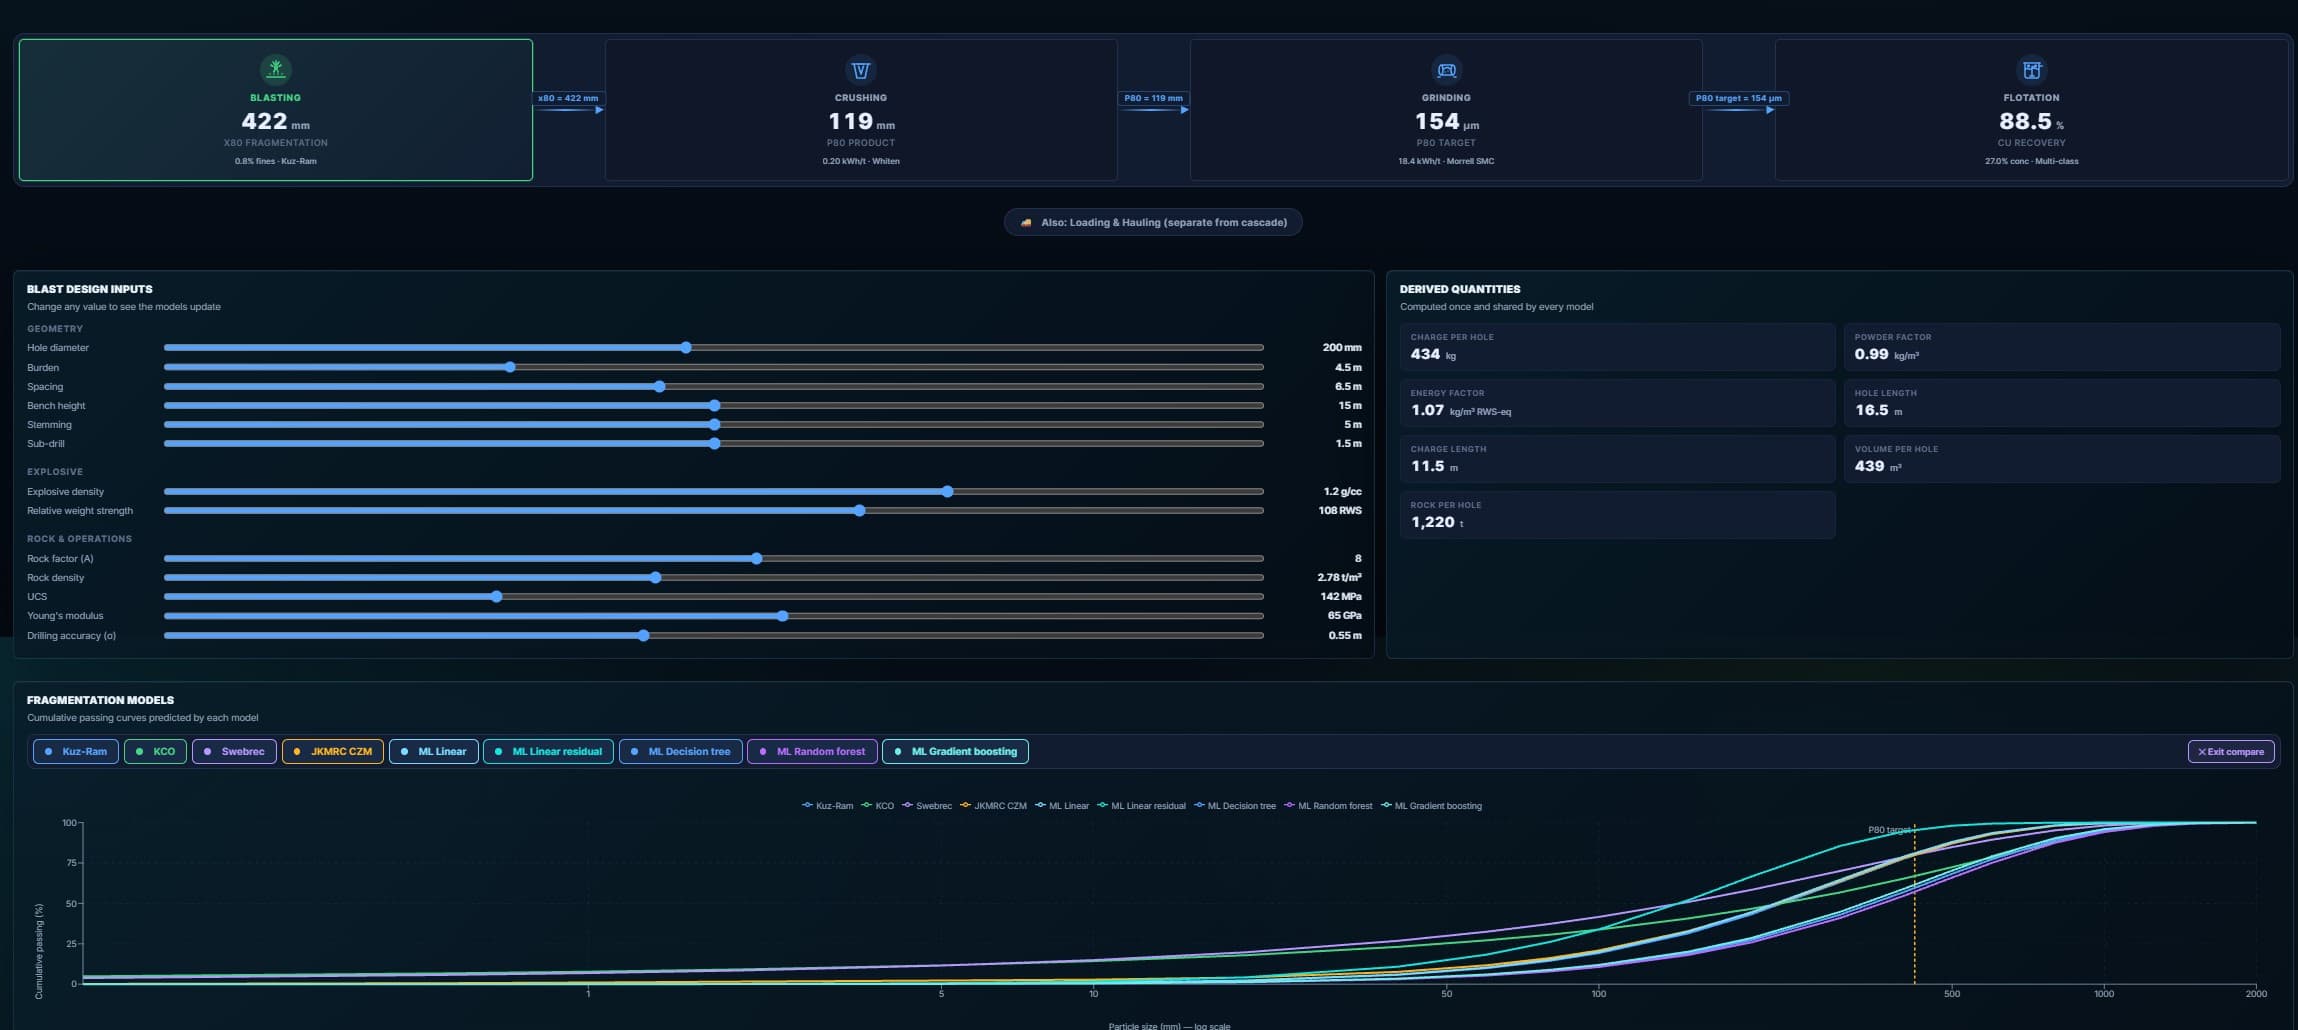
Integrated operations overview
Shift timeline, decision status, production accounting, and module cards
The homepage summary stays simple. The Platform page explains each view in depth.
Featured model
One operating context across geology, mine, plant, lab, energy, cost, and product signals.
Compare operating choices before downstream effects appear.
Follow material, quality, performance, and value from block model to product.
See constraints, KPIs, warnings, and operating signals at the timing supported by site integration.
Preserve assumptions, confidence, constraints, sensitivity, and audit evidence.
Mine, plant, energy, and commercial teams work from one operating picture.
Test operating pathways as scenarios, not after the production loss.
See where tonnes, recovery, and kWh/t trade against each other.
Link blast and fragmentation choices to crusher, mill, and recovery response.
Frame feed variability and operating settings against product outcomes.
Every recommendation carries assumptions, confidence, and an audit trail.
Pilot pathway
Discuss the data, models, constraints, scenarios, and evidence needed to test a high-value mining decision with site experts.
Test one operating decision with site systems, constraints, and measurable outcomes.
02Connect OreNeda with specialist models, data platforms, or mining workflows.
03Review product direction, market position, validation path, and adoption strategy.
Validate a decision workflow.
Request a demo